What's in this article?
We're all so busy running our businesses that unless you are a professional marketer the thought of delving through Google Analytics' various screens can be very daunting! Hopefully this list of Analytics' features will help you find out useful things about your website and marketing performance in just a few minutes.
1. Insights
As soon as you login to your Google Analytics account you'll see top right a link called "Insights":

The idea of these Insights is to tell you some of the interesting things that Google Analytics has noticed about your site in a nice clear, but pretty random list. But it's quite fun to have this list of various metrics and it's right there on our dashboard waiting for us as soon as we log in. So we don't need to delve into anything straight away.
To the right here, we have a typical list of Insights from Google Analytics. It's an interesting list and we need to consider each one seperately.
The first one is saying that users viewing our site with the Firefox browser are performing badly.
The second one is giving us some general week by week performance. We can find these things elsewhere, but it's nice to have them listed here, especially if we haven't looked at reports that contain this data before.
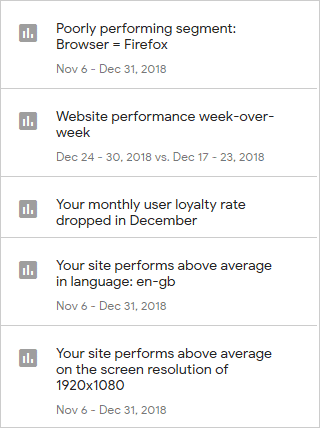
Our user loyalty rate dropped in December and the final one is saying that our site performs above average on large screens.
Viewing Insight Detail

If we click on an item in the list it'll give us more detail about it, as we can see here on the left.
Here we have clicked on the first item "Poorly performing segment: Browser Firefox" and we are presented with more detail about why Firefox is considered as "poorly performing".
The Insight is saying that only 14.59% of sessions are from people using the Firefox browser. This isn't necessarily a bad thing, but analytics has flagged it anyway. For some data it would be relevant but we won't worry about it too much here.
Of more interest in this case is that the Average session duration is only 33 seconds and the bounce rate is 86.15%.
The average session duration is saying that users with Firefox are only staying on the site for 33 seconds compared to other sessions where they are staying on the site for 2 minutes. This is quite a large difference.
The bounce rate is also slightly higher, although not drastically so. Maybe we should investigate if there is a technical problem with the website when viewed in the Firefox browser. It could be that there is a display issue or something drastic causing visitors to leave the site.
Let's also look at the Insight that says "Your site performs above average on the screen resolution of 1920x1080".
When we click this one we get the details on the right here.
This insight is saying that 21.21% of our sessions use a screen resolution of 1920x1080, a fairly typical resolution for desktop monitors, but not so much for mobile phones.
It is saying that users in this category are performing better on some key metrics, namely "Avg. Session Duration" and "Bounce Rate".
There is a large difference in the Avg. Session duration here. Users in this segment spend nearly 7 minutes on a page before they leave, or "bounce". This means they are seriously interested in what we are saying or selling on this website.
On the other hand, users with other screen sizes only stay 26 seconds on average and 91.03% of them leave the site without going any further.
We would expect a higher bounce rate on mobile than desktop (at the time of writing), but there could be an issue with how the site performs on mobile phones, is it slow, are there page rendering issues, legibility issues etc.
However, we also know that on this B2B site, out of all our audience the ones that are most likely to buy from us are probably sat in an office using a desktop computer with this screen resolution.

Either way, it's an interesting Insight and makes us think about our website and possibly flags potential issues that we may need to improve on.
2. Aquisition Overview
One report I really like is the Aquisition Overview. To get to this report in the left hand menu, click "Acquisition" then "Overview":

This report is great because it clearly shows you which channels users are arriving on your website by.
For example, if I know the website address already and type it into the url bar, I'll be classes as a Direct visitor. What's more, this report tells me that direct visitors have the highest average bounce rate and view just over 2 pages per session.
What if I am spending a lot on Paid Search using Google Ads? Well I can see from hovering over the orange/red segment in the pie chart that 6.5% of my traffic is from paid search and 24.1% of my traffic originates form the "free" organic listings. But I might be getting a good conversion rate from the paid search, so it may well be worth spending more money. Maybe I'll log into Google Ad's for more info there.
I just found something very interesting. Session duration for Referrals is over ten minutes, much longer than for any other channel:

So this is telling me that on my site I am answering questions and intriguing visitors who are arriving from the referral channel.
The purpose of search is to answer a question so it looks like I am being successful here or users wouldn't stick around on my site for over 10 minutes!
If you click on the word "Referral" it takes you to the report that lists all your referring sites and from here you can identify sites on an individual basis where users are coming from and how long they stay on your site etc.
I have blurred out the names here to keep my data private, but we can see the list of referring sites and their users, bounce rate, avg. session duration etc:

3. Real-Time
Real-Time is really interesting feature that shows you what is happening on your site in real time, as it happens. This means you see visitors appear in the Real-Time view pretty much as soon as they land on your site. What's more it shows your top active pages and the visitors location too. As I write this post, we can see that I am currently the only visitor on the site and the active page is the url of the post as I work on it (a Concrete5 style url):
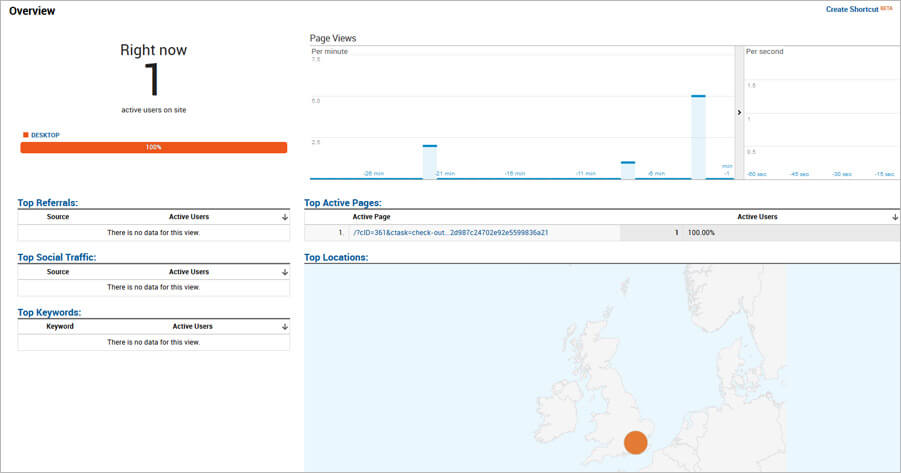
We can see 30 minutes back at how many users we had and top referrals, social traffic and keywords, although we need a bit more data to show those.
Imagine you're sending a big tweet, you can see in Real-Time how many people engage with you and click through to your site. Then you can see how long they stay and what other pages they visit.
The Real-Time section of Google Analytics has various sub pages such as Locations, Content, Events and Conversions so you can see your goals being reached as it all happens.

4. Behaviour Overview
"Behaviour" is another Google Analytics section that gives powerful insight into how people interact with your website.
The Behaviour Overview page gives us a quick look at our page views, the average time people spend on a page, bounce rate and exit rate. It also shows how many page views we get against our top pages, which is great to see how content is performing for our pages.
Page Views
The top part of the page shows page views over time:

As with all Google Analytics views, we can change the range top right to see how our page views change over time. We may want to look back over the last 4 years to see how we are doing:

Using data like this, you can see if your audience is in decline or not. If, every year or every 6 months your traffic is stepping down, then you know you need to start doing something about your SEO to begin building up your audience again.
In this case, we haven't really done much for SEO and we can see that we used to have much higher traffic back in 2015 on average than we did in 2017/18, but then things start to pick up again.
Of course, this is just page views, so some of these views will be paid traffic, social media referrals etc. so it's not all about SEO. To get a better picture of the state of our SEO we would view the organic channel under Acquisition > All Traffic > Channels and select "Organic Search".
Behaviour Overview Graphs
There is probably a more techical name, but I'm now talking about the small graphs under the main Page Views graph showing total Page Views, Unique Page Views, Avg. Time on Page, Bounce Rate and % Exit:

These graphs are telling us:
- Overall we have 292 page views in this period.
- Unique page views are 183. Unique page views combine the total page views from a single user on the same page into one for a session. So if a user views a particular page 3 times within a session, Google counts it as one unique page view.
- Avg. Time on a Page. In the example above, we see that users are spending 2 minutes and forty sections on average on a page. This is really great because people are taking a good look at our content and reading what it is about. If we had an Ave. Time on Page that was very short, we may be concerned that there is an issue with the display of the site that causes people to leave
- Our Bounce rate is 68.75%. This is the percentage of visitors to our site that navigate away after only viewing one page. It's quite high here, but we only offer services to the UK really and have a lot of traffic from the US. For the UK we can go to Audience > Geo > Location and we see that our bounce rate is much lower at around 40%:

- The Exit Rate is the percentage that were the last in the session. So from Google's article here, consider we have these 4 single session days:
- Monday: Page B > Page A > Page C > Exit
- Tuesday: Page B > Exit
- Wednesday: Page A > Page C > Page B > Exit
- Thursday: Page C > Exit
- Friday: Page B > Page C > Page A > Exit
5. Location & Language: The Geo Report
Whether you run a multi-national business or a local one, it's important to find out the location and language of your site visitors.
As I mentioned under the Behaviour section above, we have quite a high bounce rate and it would be easy to feel depressed about that, but by quickly checking the location of our visitors we can see that our target locations are actually much lower.
The bounce rate is inflated by international traffic, who are reading one page and then leaving the site. They wouldn't necessarily want to purchase from us because they are too far away to meet us in person and the currency/exchange rate may not be in their favour.
Language Report
The Geo reports are found under the Audience nav in the left hand column, the first one is language.
Let's consider the top two languages:

Although we get more users from the English US language it confirms that our English GB language is currently the one where our visitors are more interested in what we are selling and less more likely to conver, less likely to bounce away.
Location Report
Under the Language Report is the Location Report. Here we can see that the majority of our traffic for this period originates from the UK and US and again it confirms that the UK is our most successful location if we consider the bounce rate, pages/sessions and conversions. Also, it shows us that there are nearly twice the sessions from our UK traffic showing that people come back more:

We can also click on United Kingdom to see which regions of our are the most popular for the set period of time we are looking at:

6. Mobile Visitors vs Desktop
In recent times there has been a huge shift towards browsing the web on mobile devices as well as on desktop computers. We need to consider mobile devices as well as desktop and tablets when undertaking new web design projects.
It's important to know what devices your visitors use so you can focus your efforts and budget in the right area. So if you mostly have traffic from mobile devices, then there is no point creating content that doesn't work on smaller screens.
To find out how many of your users are using mobile devices vs desktop, there is a handy report under the Audience section of Google Analytics called "Mobile". Under Mobile are Overview and Devices.
Overview
This report gives you a nice quick look at the percentage of users using each device:

So on mobile our bounce rate it high, session duration looks incredibly low and there are no conversions of course. Our site is responsive and mobile friendly, but there isn't a huge amount of mobile use in this period, so we would be better off changing Analytics to show a longer period and seeing how it performs.
Desktop usage is high for a B2B business and we already suspected that most of our users would be sitting in an office, so this confirms this.
However, a lot of businesses are seeing much higher mobile use from people on the go. There is only one way to know for your business - check the mobile overview report.
7. Devices
The Devices report is interesting because it drills down to show you what brand and operating systems are being used:
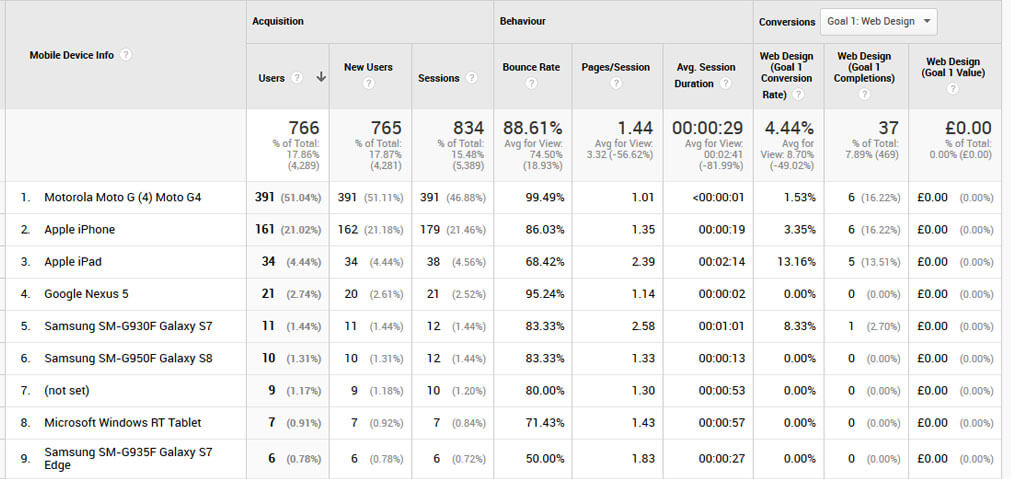
To get a wider range of data, I've increased the current period so we are viewing a much longer time frame.
The Motorola Moto G4 is strange I suspect the header for that device is being sent by a scraper or crawler. The popularity of the iPhone is no surprise.
What we are really looking for here are high bounce rates on certain devices, although we need to be careful to see where the users of those devices are coming from. We already know that we get a high bounce rate from our US traffic, so devices that are only available in the US might have a high bounce rate here.
Or there could be a problem at a certain resolution. These Google Analytics reports are great at flagging issues, but of course it is up to us to go something about those issues.
8. Check your Landing Pages
So how do you know how well each of your pages are performing in Google? Well, it's one of my favourite reports, the Landing Pages report.
The Landing Page report under Behaviour > Site Content > Landing Pages shows you the popularity of all pages and the usual data such as Users, New Sessions, Bounce Rate, and Avg. Session Duration etc:

As we would expect, the homepage is very popular, which is normal.
Next however, we have written a blog article which is quite popular about adding git pull and push icons to netbeans.
After this is our blog page itself, then our service pages.
9. Conversions
Goals
What is a goal? A goal is something you want your visitors to do when they come to your site. It's nice having visitors, but for business websites we want those visitors to do something like buy a product or make an enquiry which could result in a sale.
First of all, you need to tell Google Analytics what your goals are, by setting up your goals.
Then on the Goal overview page, Google Analytics will list your Goal Completions, Goal Conversion Rate etc. I have blurred out some of the values below to keep my data private, but it gives you the idea:

Below this, you can switch between viewing your goals by url (i.e. the urls people reach to trigger a completed goal), or by source/medium, i.e. Whether users triggering each goal come direct, or by organic, social media etc.
Again I've blurred out some of the data, but as you can see that each view shows the percentage of goal completions for each goal:


This all helps you to discover how often people actually enquire or buy from you and the source/medium view can help you discover how affective your advertising is on certain websites.
E-Commerce
This section is really important for people running online shops. On this report you can check product and sales performance. You can even list brands and categories in order to discover what is selling well and what isn't.
On the E-Commerce overview page, you can see your top sellers and the percentage of Product Revenue that they generate. You may even change the date range and find that different products are more popular at different times of the year.
Here is an example E-commerce Overview. It's a similar screen to the Goals overview but deals in revenue, conversions, Average order value and top selling products:

10. Site Speed
Everyone's talking about site loading times or site speed for short. It's important for users because no one is going to stay on your website if the pages are taking a long time to load.
However, recently it's become important for SEO too because Google is using site speed as a ranking factor. An SEO Consultant in London believes site speed is going to become even more important in the next 5 years. People simply do not have the time and patience to spend waiting 7 seconds for a website to load.
Google Analytics gives us a Site Speed report that shows how our site performs over time. We want to know if our site is sometimes slow, it might be that in peak times the server is overloaded and it slows right down.
Here is the site speed report showing blips where our website was slower than usual:

Modern dynamic sites use caching to speed things up and there can be times when the cache expires so we'll see our site running slower.
Or it could be that our host was just running slow at those times.
Below this are a series of graphs to break down the site speed into components so you can identify where any bottlenecks may arise. For example you could have slow DNS or a poor server response time affecting your sites' speed:

Below this are a series of tabs where we can see site speed by Browser, Country and Page:
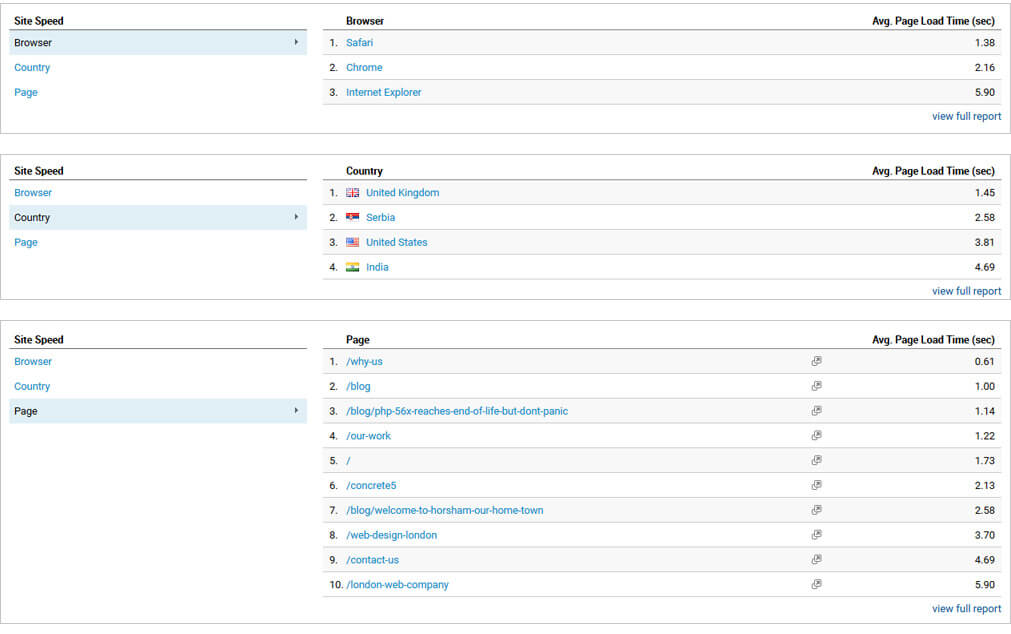
Not all browsers are equal, some simply aren't as fast. An old version of Internet Explorer is glacial compared to the latest Chrome because it uses older technologies and doesn't have the clever features that Chrome uses to make web pages faster. Or maybe some browsers come bundled with devices that run faster, such as new iMacs.
Typically our site will be slightly faster in the UK because we host here, although we can use a CDN like Cloudflare to ensure it is faster globally.
DIfferent pages load at different speeds too. The code behind them may vary, for example if a page has a huge page list it could be slower than a page with text and a few images.
With the Site Speed reports the important thing is that we can look for patterns and trends that may identify poor performance for a page type across a range of pages or literally just one page that performs badly.
We just took on a new hosting customer who had a site that was running at a reasonable speed apart from his Event pages which were running slowly. For this client these pages were really important, they represented the product or service pages for his business. Tools like the Site speed report can help identify these important issues.
There are other pages in the site speed section, but the Speed Suggestions one is interesting too. It lists your pages and a total number of suggestions for each:
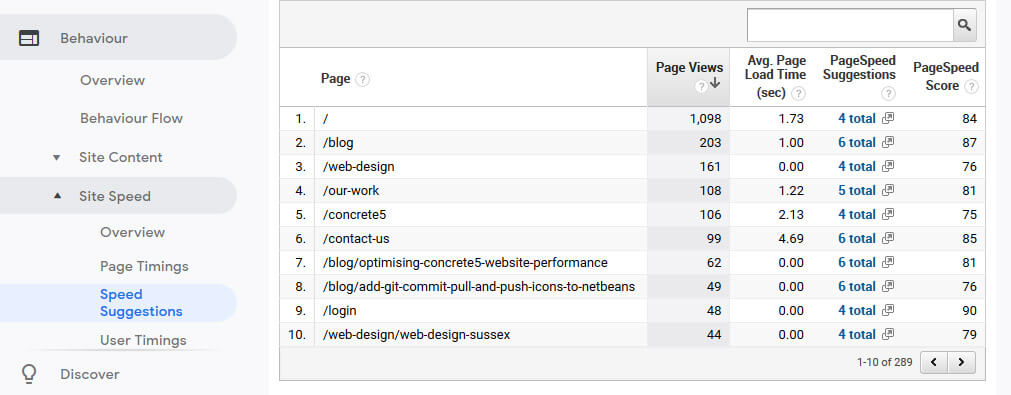
When you click on the Page Speed Suggestions text it'll actually open Google Page Speed Insights testing tool and tell you what you can do to make the page faster:

We're getting 100/100 although there are still a few suggestions! But that's ok, the faster the web is the better for everyone. Our web design Horsham team work to ensure the websites we build for our clients load as fast as possible.
Summary
This guide is intended as a beginners guide - there are people out there who know far more about Google Analytics than I do.
However, there are many business owners who could benefit from this overview of GA and it's various features. For these people they may get the bug and start digging deeper or hire someone to look at it for them as part of their SEO or marketing.
The idea was simply to give people a taste so they have some understanding and can keep an eye on what is going on with visitors to their website. I hope you enjoyed reading the article, if you have any more great ideas please feel free to comment.
One thing to bear in mind, is that you may be getting more traffic than you see in Google Analytics and to use other tools to help support the overall picture when it comes to your visitors and how they behave on your site.
If you are struggling, simply acquire professional help from a web design services team and they can help you make more sense of your websites current traffic and what can be done to improve it using seo or other marketing means.
Join the discussion
Want to have your say on this topic? Start by posting your comment below...
Can we help?
We are a digital agency, specialising in web design, development, hosting and digital marketing. If you need help with anything, feel free to reach out...
Get Blogging! Grow your website, grow your business!
24 February 2025
Boss your local SEO! Out perform your competitors in your area
18 February 2025
Keep up to date


